Charts
Use the kendo Ui chart widget for graphical representation of data. The chart supports various chart types such as area, bar, line, scatter, pie and donut, etc. as well as stock (OHLC). Use the type of chart that represents selected data in the best possible way.
The chart is an interactive data visualizations where you can set up the ability to choose chart data, chart type and input. The user can also hide and show the different data series by clicking on the legend. If the data is related to statuses, it is recommended to use the status color on the dataseries.
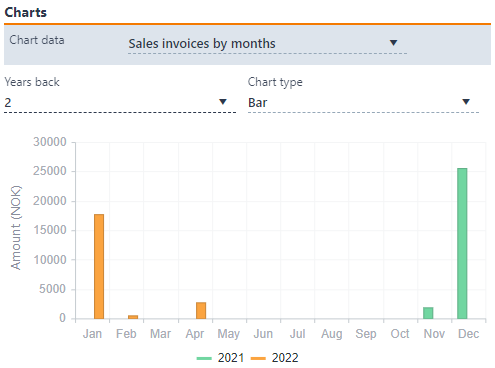
Chart types
|